Map Visual Analysis: Complexity Does Not Equal Complication
- Montel Caruthers

- Jan 16, 2019
- 2 min read
Updated: Feb 12, 2019
Our first project of the semester involved learning how to encode and decode maps. I was given a map of the Smithsonian Hometown Teams traveling exhibit to analyze visually in terms of its iconographic and iconologic meaning. According to Panofsky, iconographic meaning refers to the visual elements that are the subject of a map. The iconologic elements are the meaning and context of use of the map. Given this information, I took to design my own map based on the visual elements in my assigned map to analyze.
From examining the visual structure of this map, and creating my own, 3 things became clear to me worth noting.
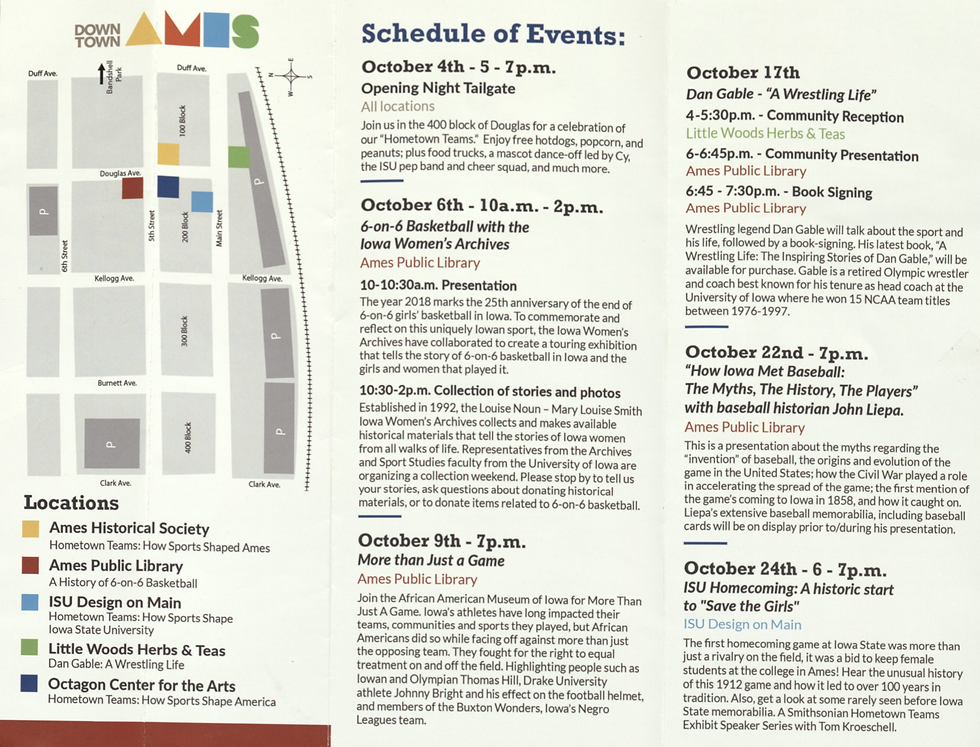
1. Complex information does not have to be complicated. The simplification of a living community of Downtown Ames to squares and shapes was fascinating in its ability to not loose a sense of the space or its meaning in terms of the exhibit.
2. Text isn't always the answer. This map had way too much text in my opinion, and was not very visual. There was a simplicity and hierarchy to the text information on each exhibit, but I believe that depending on the application, text can always be limited and should come secondary to graphics and symbols.
3. Silence is key and the power to effectiveness. Denis Wood talked about how omission of information and elements makes a statement of belief about what is important. This is how I learned that Complexity Does Not Equal Complication. The key is in the intentional omission of distracting and redundant information, or information that biases interpretation. In my map I sought to do this effectively to communicate day and night, intensity, sense type, object type, social living space vs. private, ad scale of objects and sensory engagement.
For reference, I chose to observe in one sitting the interactions of myself and my roommates within our apartment room for most of a day and some of the night. I paid particular attention to noting the interactions that everyone had with the objects around them, what type of objects they were, and what senses were engaged during these interactions over time. The visual goal was to use as much silence as possible in omitting text and direct representation of elements and behaviors, relying solely on symbolic elements to tell the story.
Did I succeed?

Location: Frederiksen Court University Apartments
Literary sources:
Wood, Denis. “Signs in the Service of the State.”Rethinkingthe Power of Maps, by Denis Wood et al., Guilford Press, 2010, pp. 67-85.
Harley, J. B., et al. The New Nature of Maps : Essays in the History of Cartography / J.B.
Harley ; Edited by Paul Laxton ; Introductory Essay by J.H. Andrews. Johns Hopkins University Press, 2001.


Comments